How AI Is Helping Researchers Read Sanborn Fire Insurance Maps

How Researchers Are Using AI to Read Sanborn Fire Insurance Maps
Sanborn fire insurance maps are among the most valuable sources available to historic preservation professionals in the United States. Produced for insurance underwriters from the late nineteenth century through the mid-twentieth century, they document the buildings of thousands of American cities and towns, recording each structure's footprint, construction material, height, and use.
They are routinely consulted in Section 106 reviews (the federal process for assessing how government-funded or permitted projects will affect historic properties), in nominations to the National Register of Historic Places (the nation's official list of properties worthy of preservation) and in architectural surveys.
Used alongside city directories, they allow researchers to connect a building of architectural significance, or one of sufficient age (generally at least 50 years since construction, the National Register's usual threshold) and integrity, to its former uses, owners, and occupants. That connection supports the historical and genealogical research needed to establish a property's significance and explain what it reveals about the development of the surrounding area.
The principal limitation of these sources has always been the time required to use them. Each sheet must be interpreted building by building, and each directory page line by line. Documenting a single block can take hours, and a full neighborhood can take weeks. In one study of former gas plants, a manual review of Sanborn sheets found only about one-twentieth as many sites as the AI-assisted search described below.
Advances in artificial intelligence are beginning to change this. Researchers are now using AI to read Sanborn maps at scale.

What Sanborn maps record and how AI reads them
The Sanborn Map Company produced fire insurance maps primarily between 1867 and 1970, covering approximately 12,000 cities and towns across the United States. Insurers used them to judge fire risk without visiting each property, so the sheets recorded details down to each building's proximity to fire hazards. As the Library of Congress explains, materials were color-coded, with pink or red for brick and yellow for wood frame, and abbreviations marked uses such as dwellings, stores, and saloons.
Many cities were resurveyed every few years, so a series of sheets can show how a block changed. The Library's collection is the largest, approximately 700,000 sheets, of which roughly 450,000 are now freely available online. City directories add the people who used those buildings. Published annually in many cities, they list residents and businesses by address, often with occupations.
The AI in these projects reads what is already printed on the sheet, doing the same work a researcher does by eye, only faster. In Columbus, for example, one model sorted a scanned sheet's pixels by color to produce building footprints and materials, and a second read the abbreviations for use and the numerals for number of stories.
Similar work is under way on other kinds of maps. Every result corresponds to a specific spot on a specific sheet, so a researcher can check it against the scan. AI image generators that produce historical pictures offer no such check.
Rebuilding lost neighborhoods in Columbus, Ohio
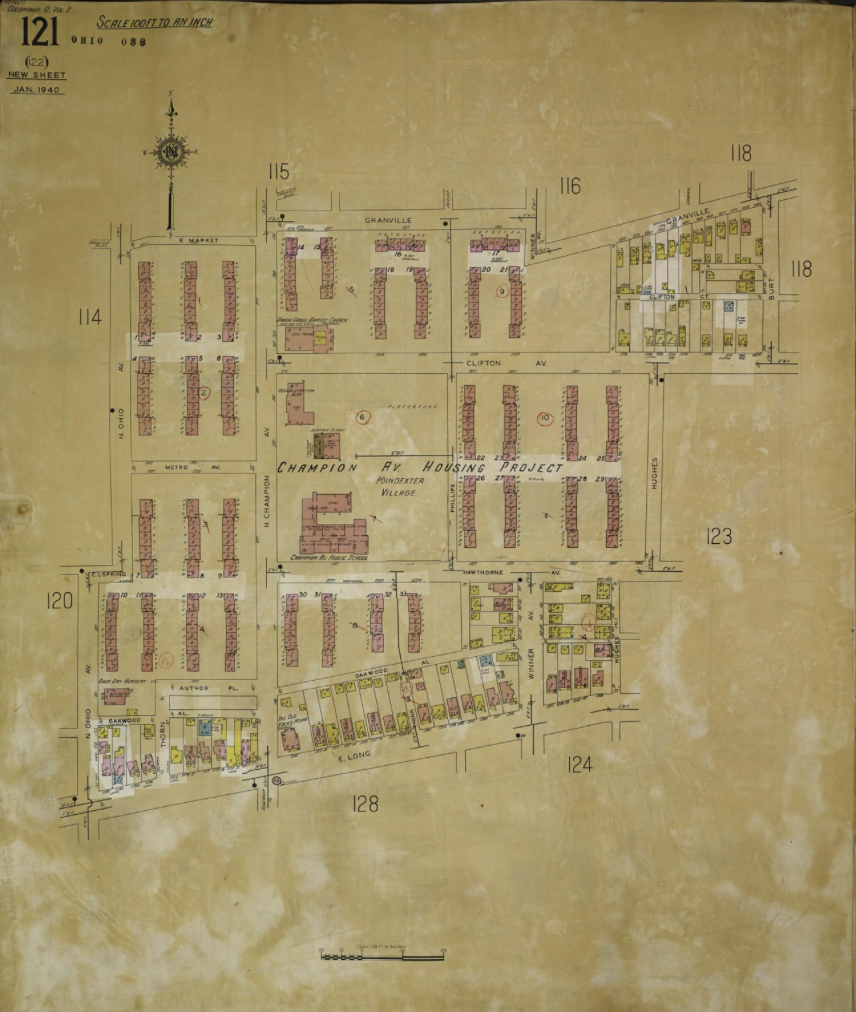
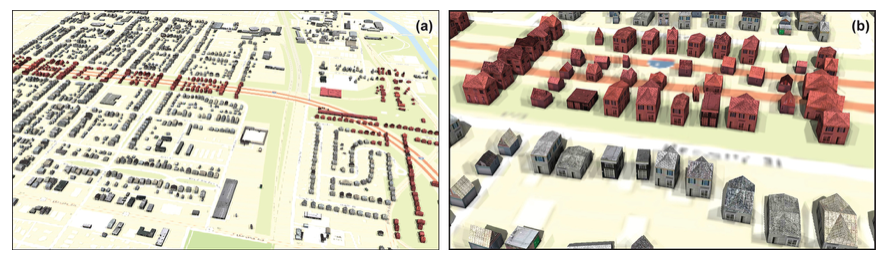
During the 1960s, interstate highway construction and urban renewal cut through several neighborhoods on the Near East Side of Columbus, many of them predominantly Black. Ohio State University's Center for Urban and Regional Analysis set out to reconstruct these communities digitally through the Ghost Neighborhoods of Columbus project. The work began with Hanford Village, where more than 100 homes, many owned by Black World War II veterans, were demolished for Interstate 70.
The first step was training AI to read the maps. Using 13 Sanborn sheets that showed Hanford Village and the adjacent Driving Park neighborhood in 1961, shortly before highway construction, the team developed two machine learning models. The first traced building outlines and identified construction materials from the map colors, and was approximately 90% accurate. The second read the labels for building use and number of stories; it was 92% accurate on use but only about 72% on stories. The resulting data showed that 380 buildings in the study area were lost to I-70, including 286 dwellings, 86 garages, five apartment buildings, and three stores.
The project then built 3D models of three neighborhoods: Poindexter Village, one of the nation's first public housing projects, dedicated by President Franklin D. Roosevelt in 1940; the Mount Vernon Avenue commercial corridor as it appeared in 1951; and Hanford Village in 1961. At community events, former residents corrected details the maps could not record, such as roofs, doors, and windows.
Remembering Greenwood in Tulsa, Oklahoma
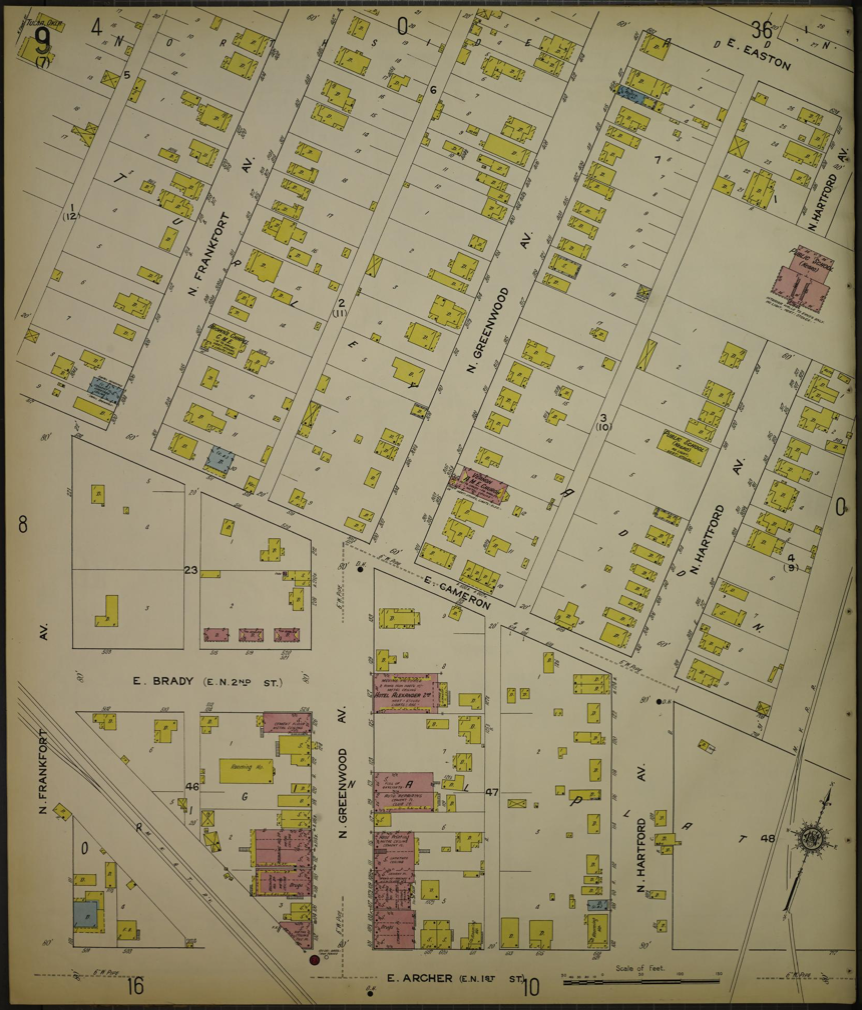
In May 1921, a white mob destroyed Greenwood, the prosperous Black district of Tulsa known as Black Wall Street. Up to an estimated 300 people were killed, and more than 1,250 homes were burned. For the centennial of the massacre, The New York Times reconstructed the neighborhood in 3D to show readers what had stood there.
Sanborn maps from 1915 and 1920 were among the team's primary sources. To turn the flat maps into 3D buildings, team member Lingdong Huang trained a neural network to identify building outlines. For training data, the team generated mock maps in the Sanborn style, each paired with a black-and-white version showing only the buildings. The trained network produced clean building footprints from the historical sheets, but it could not reliably read the height annotations, so Huang built a separate tool for entering each building's height by hand.
Next, the team ran the 1921 Tulsa city directory through optical character recognition and searched the output for "(c)," the mark the directory used to label residents and businesses of color. The finished piece walks readers along the 100 block of Greenwood Avenue, which held more than 70 businesses, including four hotels, two newspapers, eight doctors, nine restaurants, and the 750-seat Williams Dreamland Theatre. The reconstruction also marked the limits of its evidence, leaving buildings blank where no photograph survived.
Locating gas plants across 16,393 map sheets
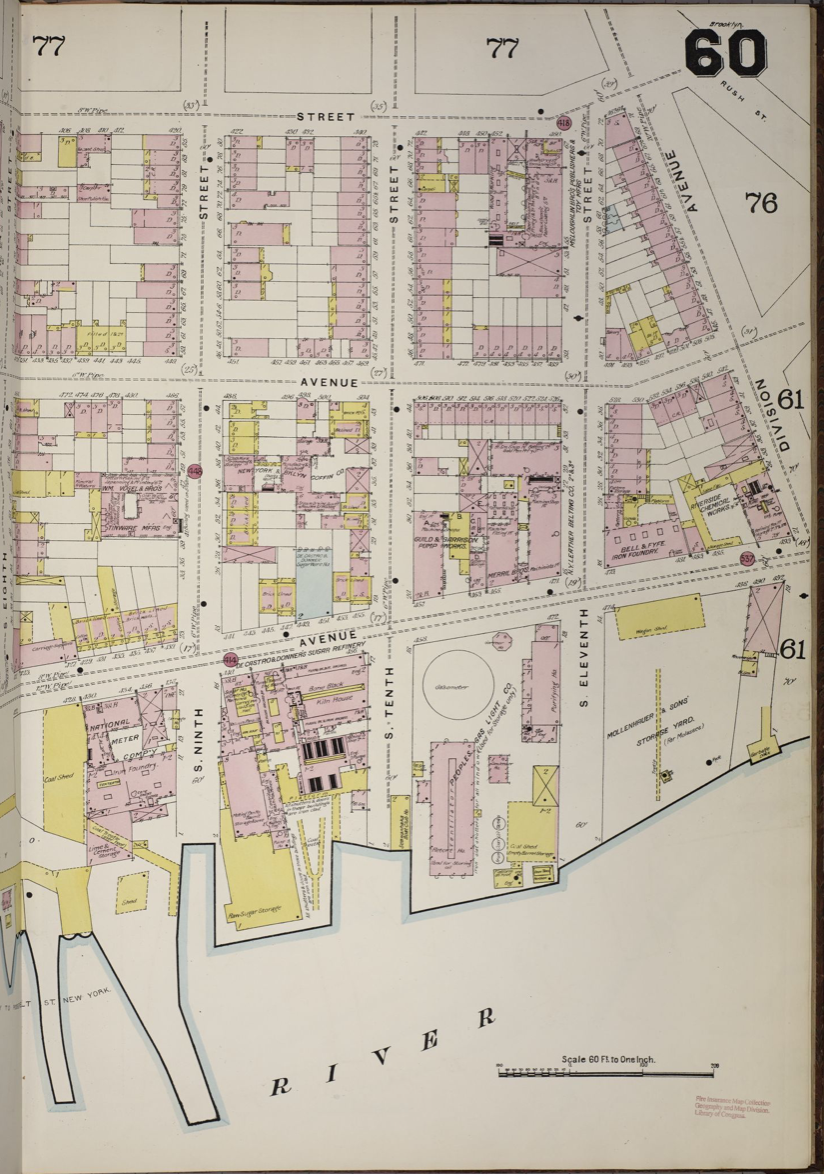
The third project worked at a much larger scale. Before natural gas pipelines spread, many American cities made gas from coal at local manufactured gas plants. The plants left lasting contamination, and many have since been forgotten. Sanborn maps recorded them, and their large gas holders appear on the sheets as circles.
Researchers at Brown University used that shape to locate them. They assembled 16,393 Sanborn map pages from the Library of Congress, published between 1884 and 1958, covering Chicago, San Francisco, Portland, New Orleans, the New York City area, and Rhode Island. An initial program flagged every circle on every page, producing 6,682 candidates, and a set of neural networks then decided which of those circles were gas structures. Besides finding far more sites than manual review, the method cut the time spent coding the maps by about 94%.
No single researcher could realistically search that many sheets by eye for circles. With the sites located, researchers can ask which neighborhoods sat closest to these plants, and in which decades.

What the AI could not do
In each of the three projects, AI did the reading, while people checked the results and decided what they meant. The same principle underlies Historica's own approach to AI-assisted historical mapping, in which every extracted fact links back to its original source and responsibility for interpretation remains with human researchers.
Some details were beyond the technology, as Tulsa's hand-entered building heights showed. In Columbus, number of stories was the hardest attribute for the models to read, and handwritten labels could not be read at all. Sanborn sheets also complicate the work because they were updated by pasting corrections over earlier drawings, which can hide what previously stood on a lot, and it takes experience to tell which date a sheet actually shows.
The Columbus and gas plant teams both checked their results against the originals. For Poindexter Village, the Columbus team compared the extracted buildings with the original sheets and corrected them before modeling. In the gas plant study, human review of the flagged pages raised the share of sites found from about 84% to nearly 90%.
Detailed reconstruction also took time. Extraction was fast, but bringing about three blocks of Mount Vernon Avenue to full architectural detail took about 700 hours. For Poindexter Village, building heights came from the original architectural drawings after estimates from photographs proved unreliable. Like Tulsa, Columbus is open about where the evidence runs out; it shows buildings without direct evidence as transparent forms.
Conclusion
Sanborn maps were made to assess fire risk, and they have become one of the most detailed records of how American cities were built and used. AI now makes it possible to search a whole city's sheets as data. Similar tools for city directories are developing alongside, including a new workflow that extracts directory entries and keeps an image of each original entry beside the extracted text so it can be checked.
For historic preservation, these tools could speed the research behind surveys, Section 106 reviews and National Register nominations, and make it practical to study a property's surrounding block along with the property itself. None of these tools judges whether a building is significant or retains its integrity; that assessment still belongs to historians and preservation professionals. For public history, they have already made it possible to walk through Poindexter Village and the 100 block of Greenwood Avenue again.